Reports and Dashboards
An integrated platform for generating reports and interactive dashboards that support analysis and real-time decision-making.
The Reports and Analytics System within the Green Codes platform provides a complete digital solution for transforming operational data into smart reports and dashboards, starting from collecting data from different modules, through analyzing trends and performance indicators, all the way to generating real-time reports that support decision-making. The system enables organizations to display data through charts, graphs, and interactive KPIs, helping improve the overall visibility of performance.
It also supports instant reports and interactive dashboards that help monitor performance and analyze trends, enabling decision-makers to take proactive actions and improve the work environment. This comes as part of supporting smart management for organizations and projects.
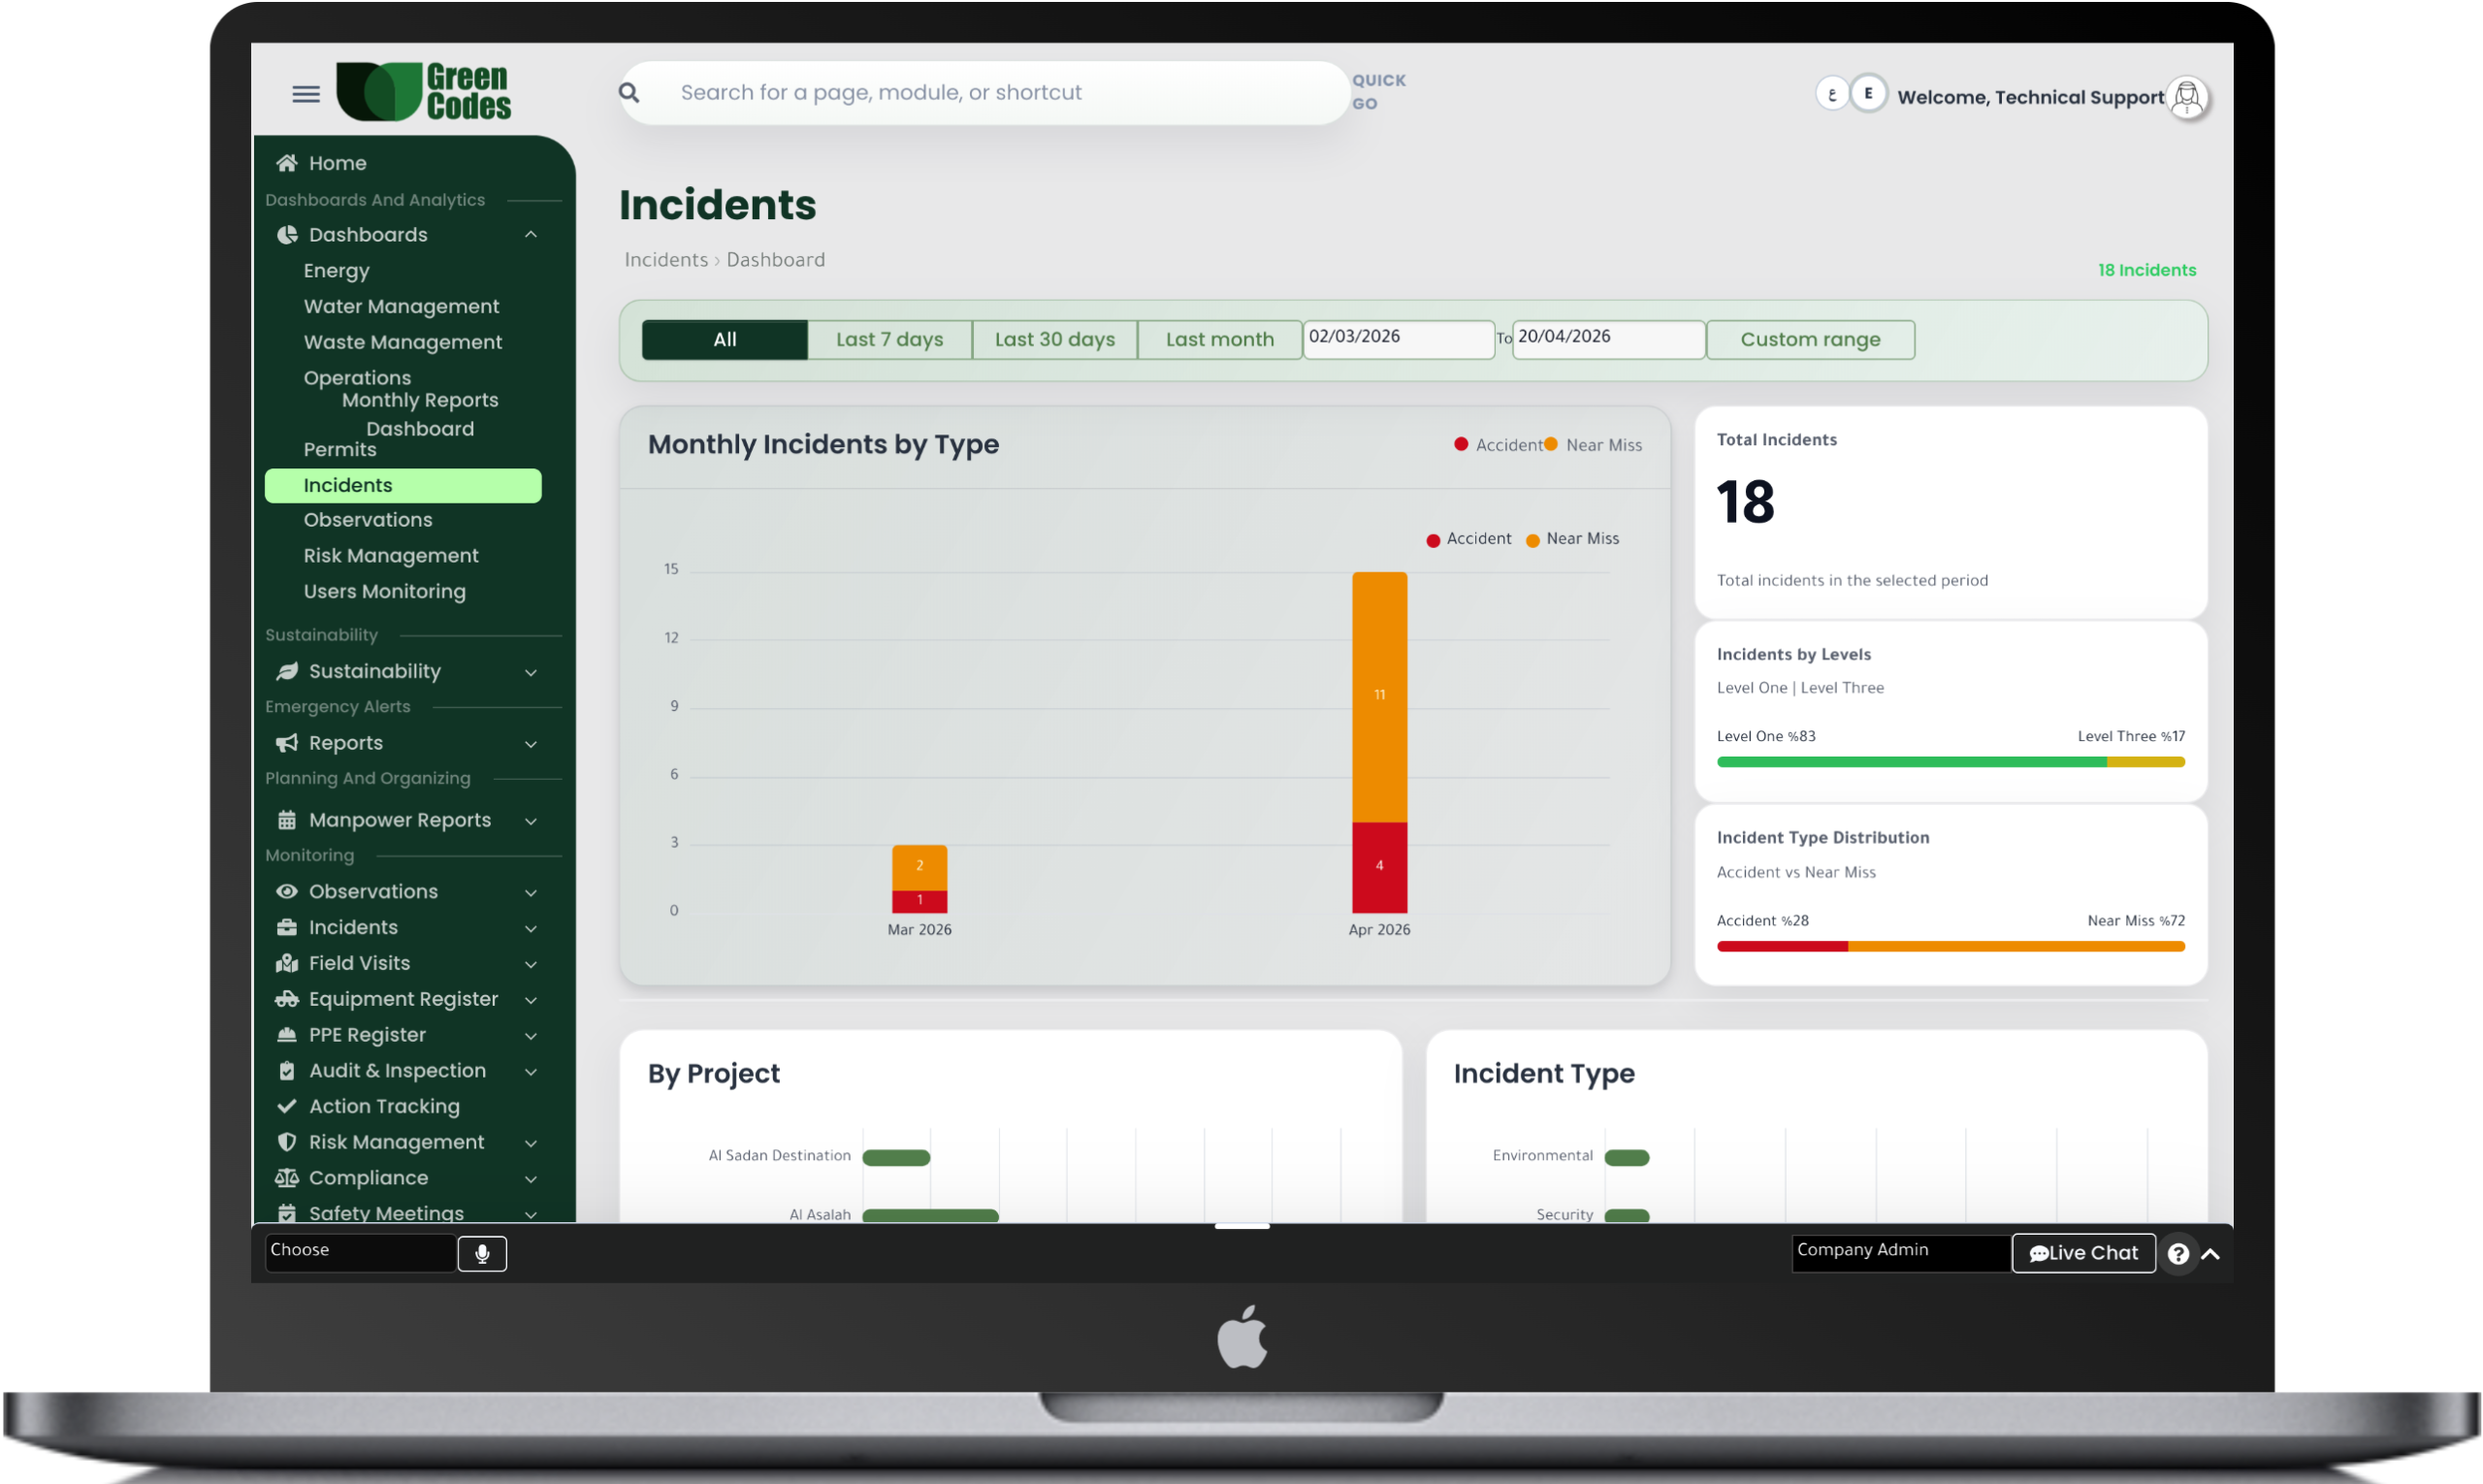
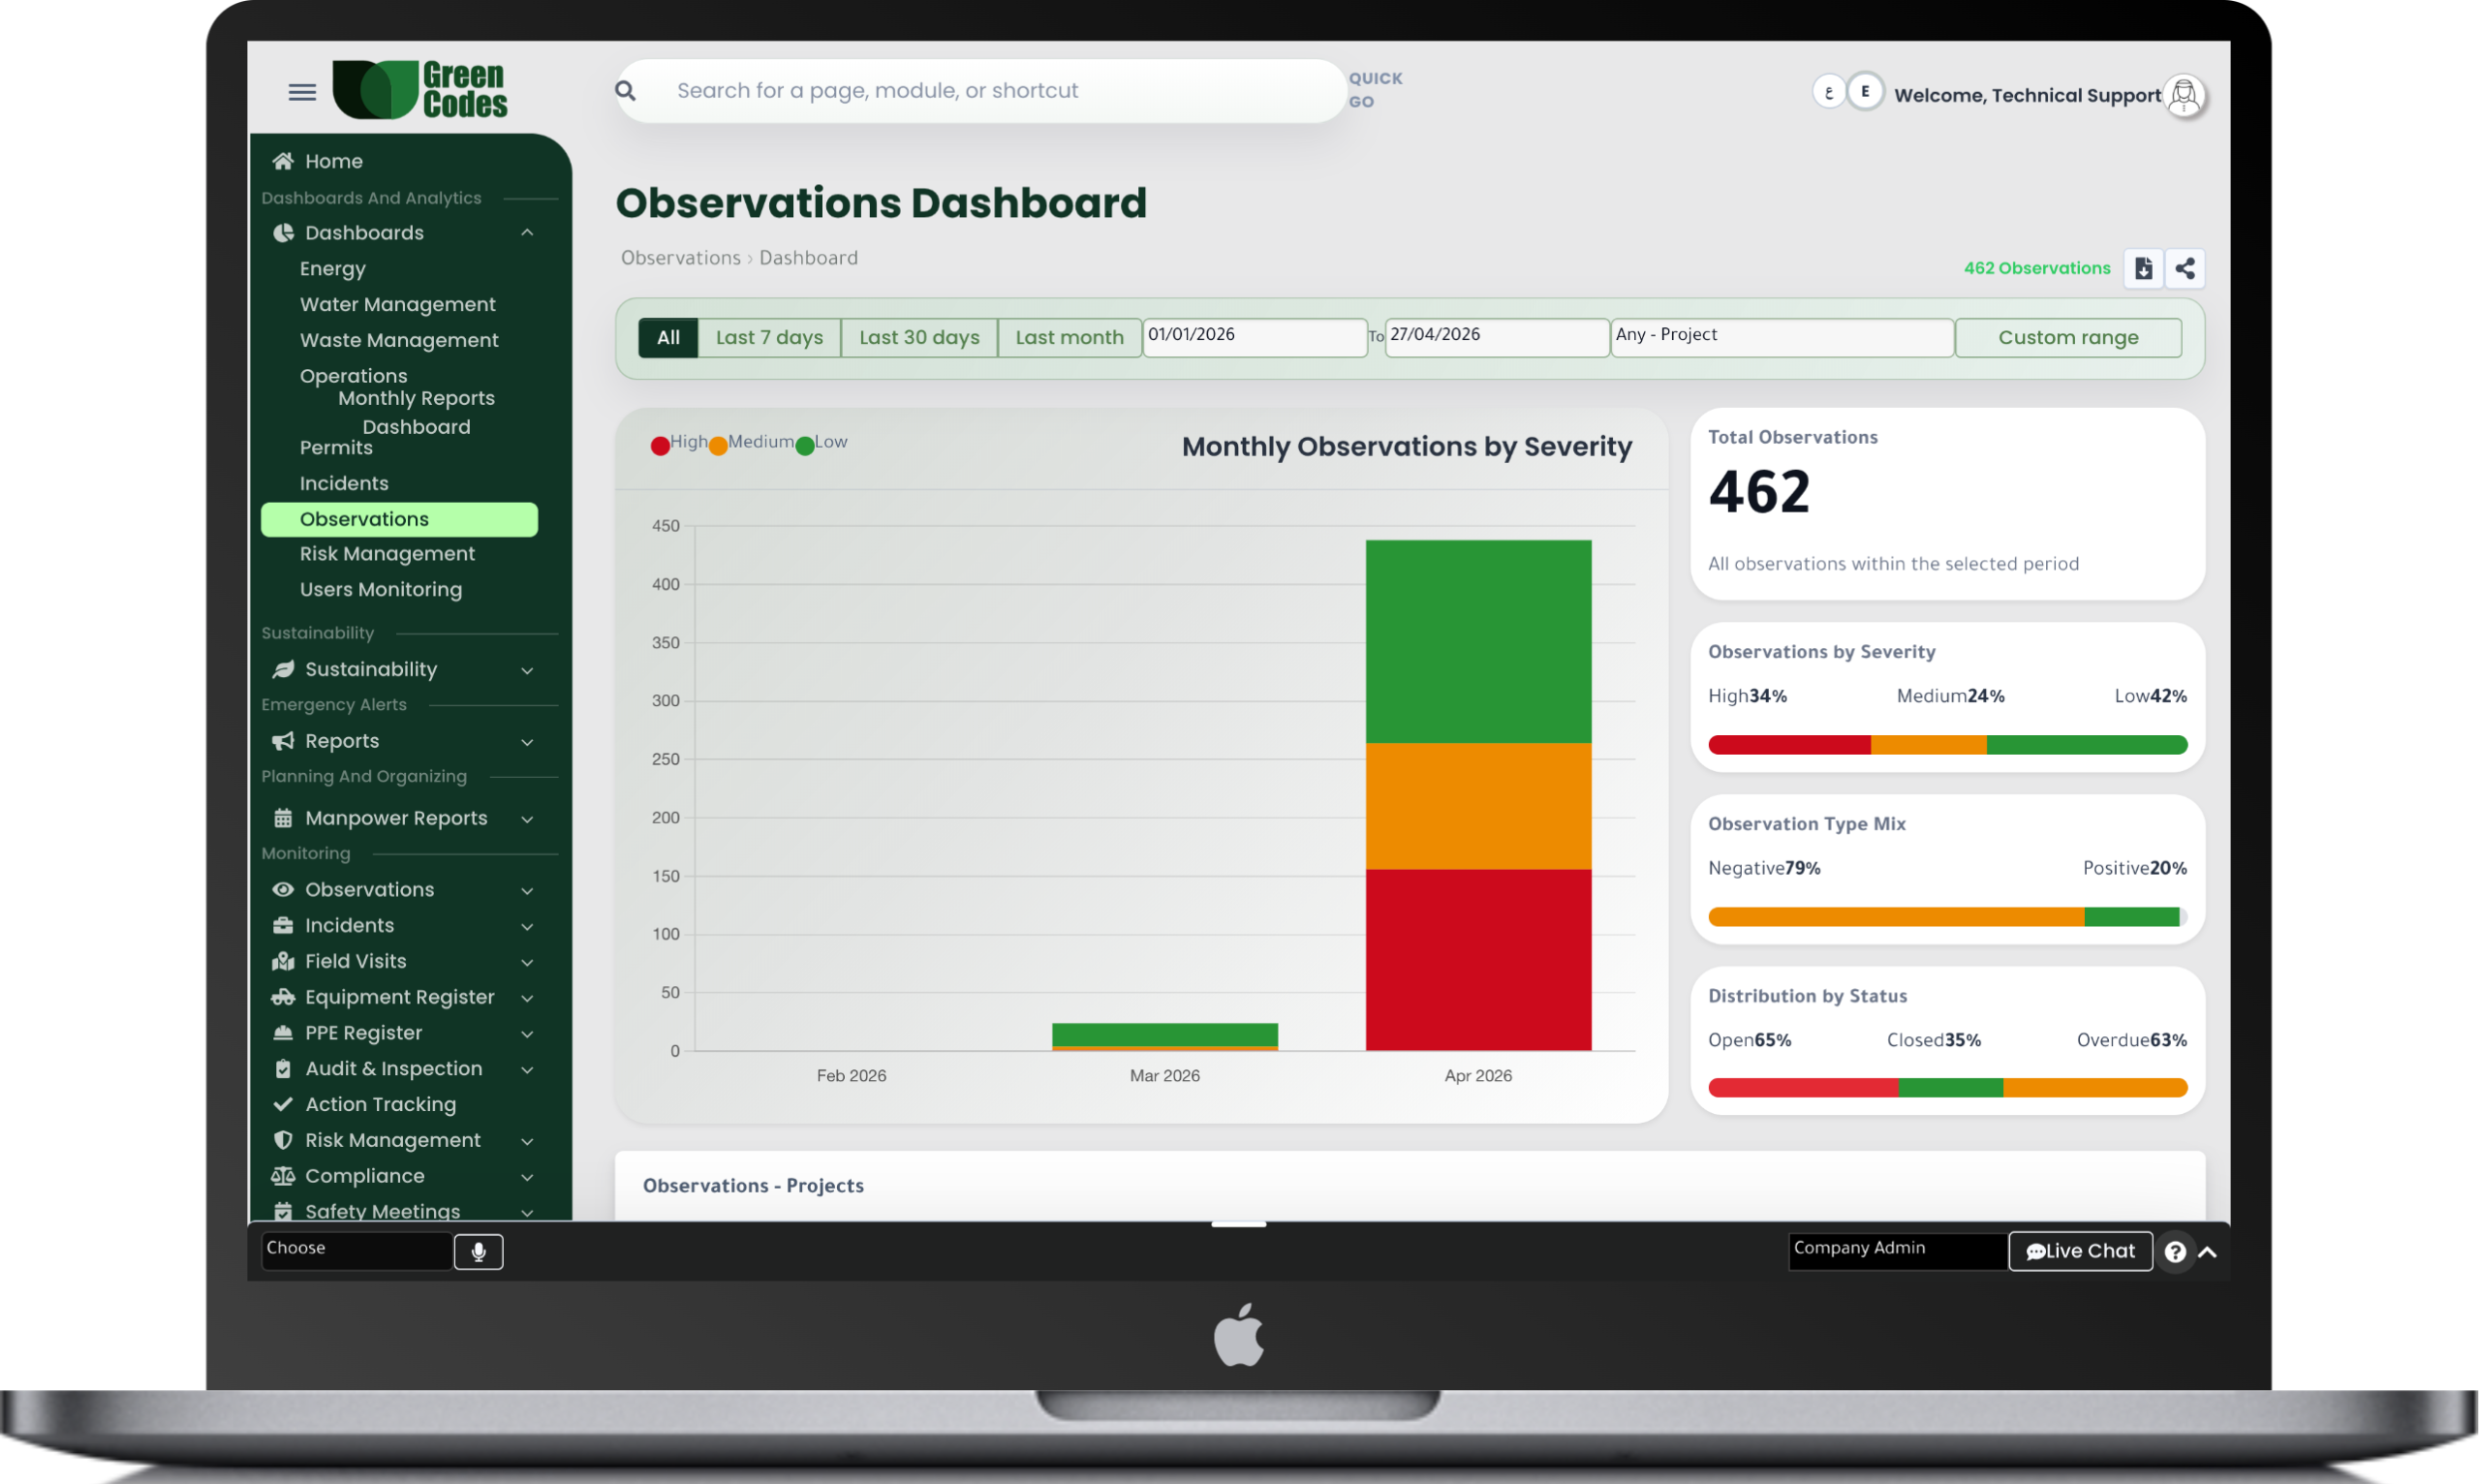
The Reports and Analytics System within the Green Codes platform provides a complete digital solution for transforming all safety and operational data into smart reports and interactive dashboards that help management monitor performance and make immediate decisions. The system allows collecting data from different modules such as incidents, safety observations, tasks, and inspections, then displaying them in the form of charts and clear, easy-to-understand performance indicators.
The system also supports generating daily, weekly, and monthly reports, with the ability to customize reports based on the project, department, or time period, helping improve the overall visibility of performance and increasing monitoring efficiency.
The system provides a wide range of reports and interactive dashboards, such as incident reports, injury frequency rates, observation closure rates, contractor performance, compliance indicators, and sustainability reports.
It also supports trend analysis and comparisons between projects, helping with KPIs (Key Performance Indicators). In addition, executive reports are available for top management, including key performance indicators that support proactive decisions based on accurate data.
The system follows a workflow that starts by automatically collecting data from all connected modules within the platform, then analyzing and classifying it based on the required indicators. After that, the data is displayed in the form of interactive reports and dashboards that can be filtered, customized, and shared with concerned parties easily in PDF and Excel formats.
Users can also export reports in different formats for sharing and official use.
Data Collection ← Analysis ← Report Creation ← Interactive Display ← Export and Sharing
- Interactive dashboard panels
- KPI charts and performance indicators
- Daily / Monthly / Annual reports
- Filtering by project or period
- PDF / Excel export
- Executive reports for top management
- Trend analysis and comparisons
- Support for immediate decision-making
Frequently Asked Questions (FAQ)
What distinguishes the reports and dashboards in Green Codes?
They aggregate data from multiple sources (incidents, observations, audits, permits, training, environment) into a single, filterable dashboard. This provides a unified view for management instead of fragmented reports for each team. It also supports daily monitoring of major projects and rapid decision-making based on updated data.
What is the difference between Leading and Lagging indicators?
Lagging indicators measure outcomes that have already occurred, such as recorded injuries and lost workdays. Leading indicators are preventive activities, such as the number of observations, inspection frequency, and training completion rates, which help prevent accidents before they happen. Professional references recommend using both types to measure program effectiveness, not just results.
Can reports be customized by project, contractor, or time period?
Yes, you can filter by site, region, contractor, activity type, or period (weekly/monthly/yearly). Custom reports can be saved as templates for recurring use in management meetings or client reporting, reducing preparation time and increasing consistency across projects.
What are examples of indicators that senior management usually relies on?
Safety: Injury rates, Near Miss trends, action closure rates, and inspection frequency.
Compliance: Number of open non-conformities, compliance percentage, and renewal dates.
Environment: Resource consumption, waste quantities, and emissions, compared against sustainability goals.
How is data quality ensured before appearing in executive reports?
Validation rules can be applied during entry (mandatory fields/value ranges) to minimize free-form entry. Approval workflows can also be activated for sensitive data—such as closing an incident or approving an environmental reading—before it is calculated in the KPIs. Documenting results within an approved system enhances report reliability.
Can reports be exported and shared with clients or official authorities?
They can be exported in formats like PDF and Excel based on permissions, with the option to add official headers. Periodic reports can also be scheduled for automatic delivery to management or consultants to reduce manual labor, which is useful for contracts requiring monthly HSE or periodic environmental reports.
How do analytics support practical decision-making rather than just displaying numbers?
Indicators can be linked to their causes; for example, linking a rise in scaffolding violations to weak inspections or lack of training, then directing an action plan. Frequency can also be analyzed by contractor, shift, or activity to pinpoint the source of a problem, fostering continuous improvement and directing resources to the most impactful controls.
How is data privacy protected within dashboards and reports?
Personal fields can be hidden in public reports, with sensitive details made available only to authorized teams. Permissions can also be applied at the project level to prevent one contractor from seeing another project’s data. This balances operational transparency with data protection requirements within the Kingdom.